Ever get halfway through stringing the lights on your tree only to realize that you don’t have enough?
Maybe this year you plan to get a larger tree than usual and want to know how many strands and what size lights to use to make it really “merry and bright”?
Or, have you ever thought about how much energy Americans use (in excess) over the holidays?
What state spends the most on holiday decorations and all those illuminated silver bells?
We’ve compiled a ton of holiday facts and stats that will help you navigate your festive decor this year, starting with the exact measurements you’ll need to figure up the perfect number of lights for your Christmas tree.
How Many Lights for a Christmas Tree?
The question of how many lights to use on a Christmas tree often comes down to personal preference, but there are some practical guidelines to follow.
A general rule of thumb is to use 100 tiny lights per foot of tree height for a subtle glow, or 200 lights per foot for a brighter, more festive display.11
For example, a 6-foot tree would look splendid with anywhere from 600 to 1,200 lights, depending on your desired level of brilliance.
The type of lights you use can also affect the number.
LED lights, for instance, are more efficient and brighter than traditional incandescent bulbs, allowing you to use fewer lights while still achieving a vibrant display.3
Additionally, the wiring of holiday lights plays a crucial role in functionality.
Modern holiday lights are wired in a combination of series and parallel circuits. This means if one section of lights goes out, the rest will usually remain illuminated.
Advances such as shunts and fuses add extra reliability and safety to light strings, making them easier to maintain and operate.9
What States Decorate the Most for Christmas Holidays?
Many states go all out for holiday decorations, especially those that rely on end-of-the-year tourism.
Thankfully, Christmas tree lighting has come a long way from the days of candles perched precariously on evergreen boughs.
One standout innovation is the growing popularity of LED lights, which use up to 75% less energy and last 25 times longer than their incandescent counterparts.1 And, many states have integrated this upgrade into their yearly festivity.2
Meanwhile, some rural areas maintain traditional practices, like using warm white lights or even candles, reminiscent of old-world customs.4
For example, Pigeon Forge, Tennessee, boasts a display of over 5 million lights, drawing visitors from across the country.6 And Gatlinburg, Tennessee which is a shining example of eco-conscious holiday decorating.
The city converted its Winter Magic lighting program to LEDs in 2008, achieving an 85% reduction in electricity costs for the four-month display.8
Additionally, Gatlinburg’s initiatives, such as energy-efficient retrofits and solar-powered waste receptacles, align with a broader mission to protect the Great Smoky Mountains while celebrating the holiday season.8 Similarly, the Atlanta Botanical Garden features a dazzling one-mile lighted garden path, offering a magical holiday experience.7
Both Gatlinburg and Atlanta showcase how public displays can reflect a community’s values while offering joy and inspiration to residents and visitors alike.
How Much More Energy Do We Use During Christmas?
The holiday season is magical, but it can also be expensive, especially when it comes to powering those festive lights.
LEDs help reduce costs, consuming a fraction of the energy used by incandescent lights. Over ten years, running incandescent C-9 lights could cost over $120, while LEDs for the same period cost just $18.1
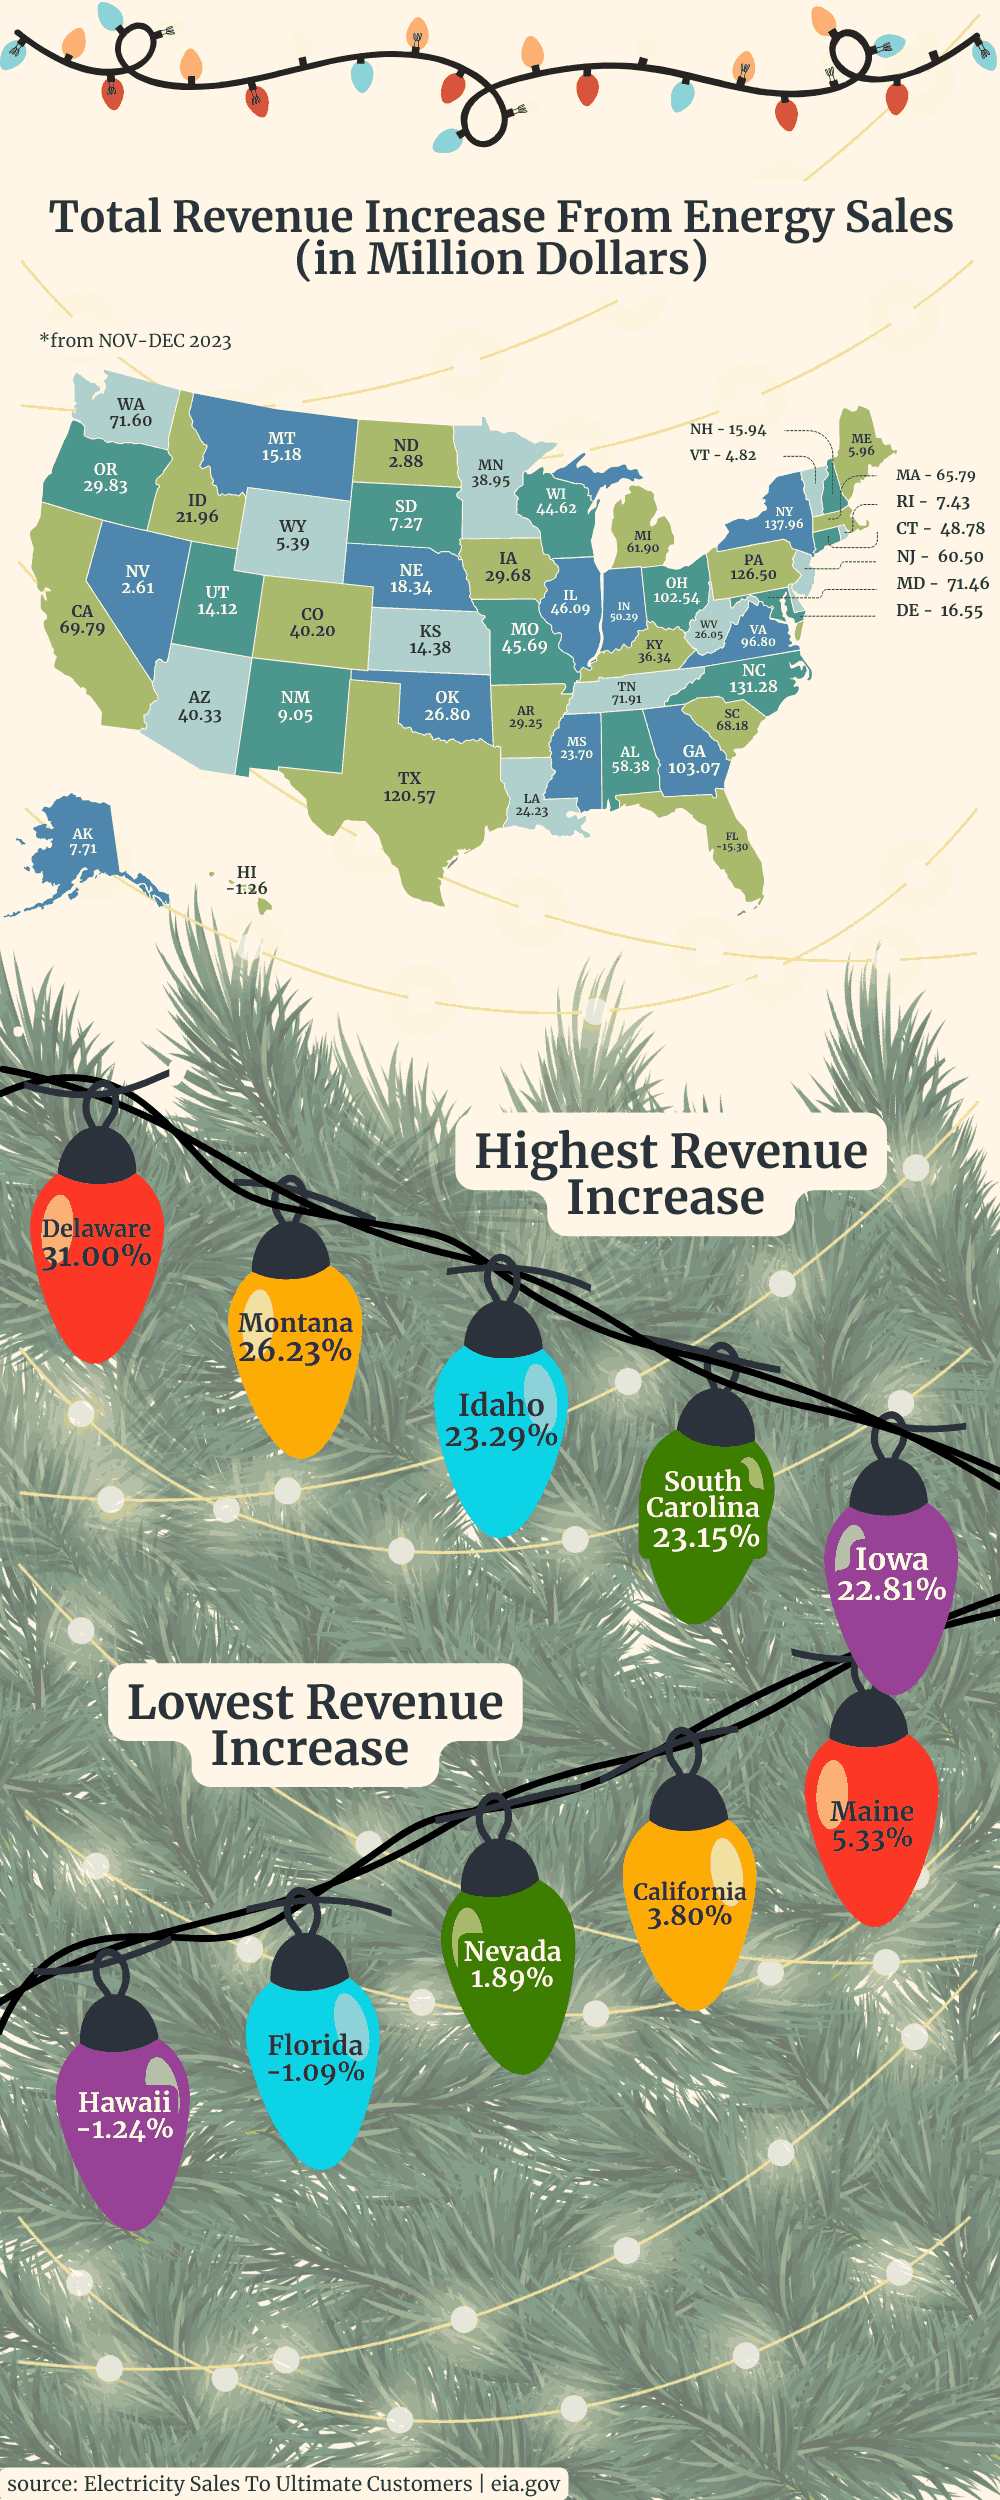
| Total Revenue From Energy Sales (in Million Dollars) | ||||
| State | Nov 2023 | Dec 2023 | Total Difference | Percentage Increase (%) |
| Delaware | 53.38 | 69.93 | 16.55 | 31.00 |
| Montana | 57.86 | 73.03 | 15.18 | 26.23 |
| Idaho | 94.25 | 116.21 | 21.96 | 23.29 |
| South Carolina | 294.57 | 362.75 | 68.18 | 23.15 |
| Iowa | 130.10 | 159.78 | 29.68 | 22.81 |
| Nebraska | 81.89 | 100.23 | 18.34 | 22.40 |
| North Carolina | 586.30 | 717.58 | 131.28 | 22.39 |
| West Virginia | 122.74 | 148.79 | 26.05 | 21.22 |
| Tennessee | 347.86 | 419.77 | 71.91 | 20.67 |
| Virginia | 470.76 | 567.57 | 96.80 | 20.56 |
| Arkansas | 142.69 | 171.94 | 29.25 | 20.50 |
| Maryland | 352.97 | 424.43 | 71.46 | 20.25 |
| Colorado | 204.56 | 244.76 | 40.20 | 19.65 |
| Washington | 366.82 | 438.42 | 71.60 | 19.52 |
| Georgia | 529.01 | 632.07 | 103.07 | 19.48 |
| Wyoming | 27.68 | 33.07 | 5.39 | 19.47 |
| Connecticut | 263.12 | 311.90 | 48.78 | 18.54 |
| Alabama | 318.50 | 376.88 | 58.38 | 18.33 |
| Ohio | 577.34 | 679.87 | 102.54 | 17.76 |
| New Jersey | 341.17 | 401.67 | 60.50 | 17.73 |
| Alaska | 43.53 | 51.24 | 7.71 | 17.70 |
| New Hampshire | 91.00 | 106.93 | 15.94 | 17.51 |
| Pennsylvania | 735.86 | 862.36 | 126.50 | 17.19 |
| New York | 824.78 | 962.74 | 137.96 | 16.73 |
| Massachusetts | 399.08 | 464.87 | 65.79 | 16.49 |
| Utah | 89.17 | 103.28 | 14.12 | 15.83 |
| Wisconsin | 282.16 | 326.78 | 44.62 | 15.81 |
| Minnesota | 248.09 | 287.04 | 38.95 | 15.70 |
| Missouri | 291.17 | 336.80 | 45.69 | 15.70 |
| Kentucky | 235.87 | 272.21 | 36.34 | 15.41 |
| Oklahoma | 175.82 | 202.61 | 26.80 | 15.24 |
| Mississippi | 157.24 | 180.94 | 23.70 | 15.07 |
| South Dakota | 48.26 | 55.53 | 7.27 | 15.06 |
| Indiana | 348.23 | 398.53 | 50.29 | 14.44 |
| Oregon | 223.54 | 253.37 | 29.83 | 13.35 |
| Michigan | 468.30 | 530.20 | 61.90 | 13.22 |
| Arizona | 307.84 | 348.17 | 40.33 | 13.10 |
| New Mexico | 71.36 | 80.41 | 9.05 | 12.68 |
| Kansas | 116.77 | 131.15 | 14.38 | 12.32 |
| Vermont | 39.49 | 44.31 | 4.82 | 12.22 |
| Rhode Island | 66.05 | 73.49 | 7.43 | 11.26 |
| Louisiana | 221.97 | 246.20 | 24.23 | 10.92 |
| Illinois | 488.73 | 534.83 | 46.09 | 9.43 |
| Texas | 1500.53 | 1621.10 | 120.57 | 8.04 |
| North Dakota | 48.42 | 51.30 | 2.88 | 5.95 |
| Maine | 111.76 | 117.71 | 5.96 | 5.33 |
| California | 1836.34 | 1906.14 | 69.79 | 3.80 |
| Nevada | 137.66 | 140.27 | 2.61 | 1.89 |
| Florida | 1399.77 | 1384.47 | -15.30 | -1.09 |
| Hawaii | 101.26 | 100.01 | -1.26 | -1.24 |
| US Total | 16501.18 | 18659.02 | 2157.84 | 13.08 |
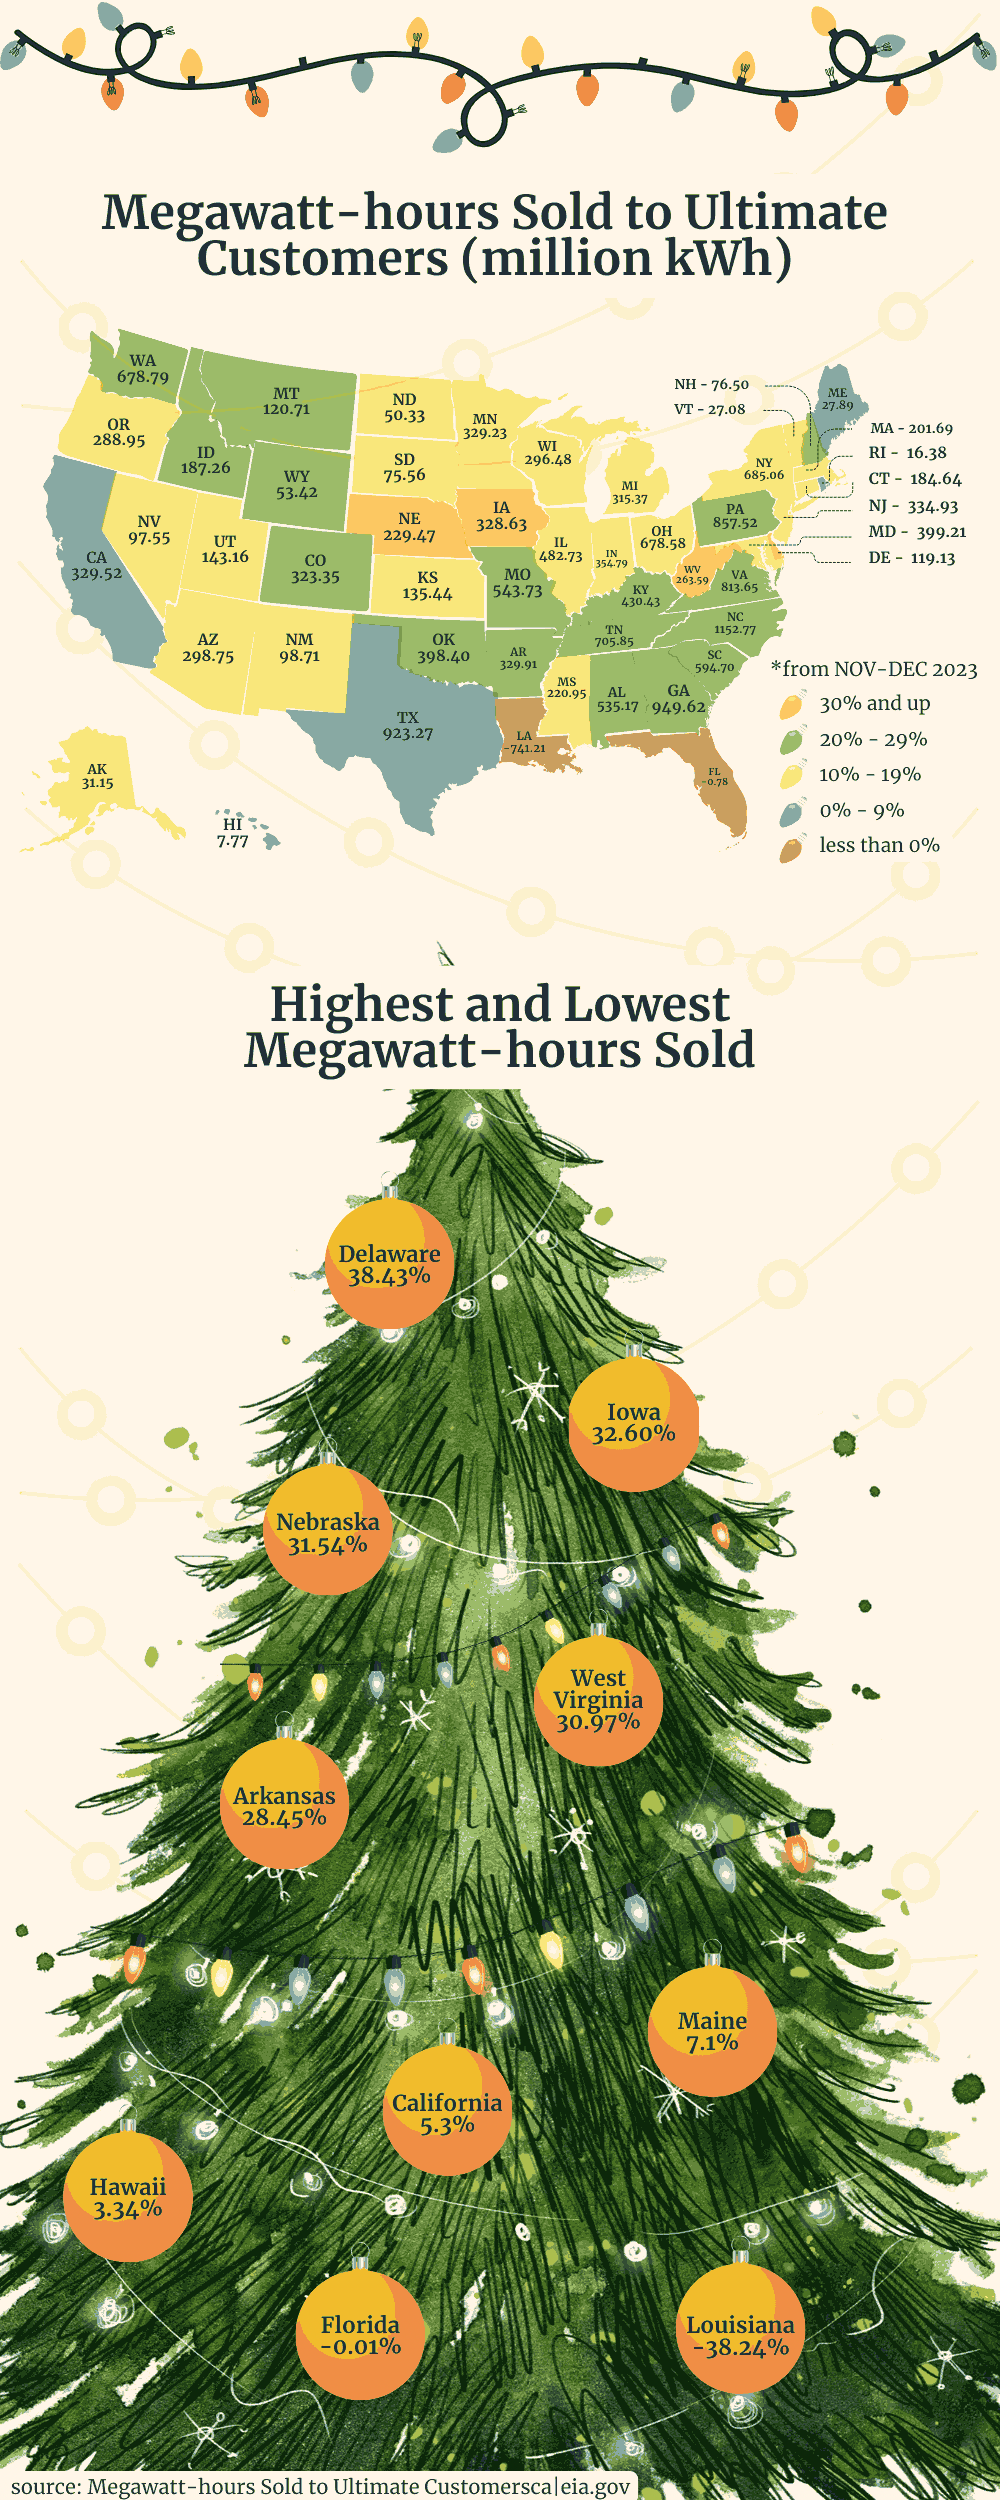
| Megawatt-hours Sold to Ultimate Customers (million kWh) | ||||
| State | Nov 2023 | Dec 2023 | Total Difference | Percentage Increase (%) |
| Delaware | 309.96 | 429.10 | 119.13 | 38.43 |
| Iowa | 1007.99 | 1336.62 | 328.63 | 32.6 |
| Nebraska | 727.50 | 956.97 | 229.47 | 31.54 |
| West Virginia | 851.17 | 1114.77 | 263.59 | 30.97 |
| Arkansas | 1159.48 | 1489.39 | 329.91 | 28.45 |
| South Carolina | 2141.05 | 2735.75 | 594.70 | 27.78 |
| Oklahoma | 1479.53 | 1877.93 | 398.40 | 26.93 |
| North Carolina | 4379.98 | 5532.75 | 1152.77 | 26.32 |
| Montana | 459.80 | 580.51 | 120.71 | 26.25 |
| Tennessee | 2761.29 | 3467.15 | 705.85 | 25.56 |
| Alabama | 2126.83 | 2662.01 | 535.17 | 25.16 |
| Kentucky | 1774.71 | 2205.13 | 430.43 | 24.25 |
| Virginia | 3379.22 | 4192.87 | 813.65 | 24.08 |
| Georgia | 4019.26 | 4968.88 | 949.62 | 23.63 |
| Colorado | 1402.90 | 1726.25 | 323.35 | 23.05 |
| Idaho | 820.94 | 1008.20 | 187.26 | 22.81 |
| Missouri | 2429.16 | 2972.89 | 543.73 | 22.38 |
| Wyoming | 238.78 | 292.20 | 53.42 | 22.37 |
| New Hampshire | 355.74 | 432.24 | 76.50 | 21.5 |
| Pennsylvania | 4063.56 | 4921.08 | 857.52 | 21.1 |
| Washington | 3312.64 | 3991.43 | 678.79 | 20.49 |
| Maryland | 2031.05 | 2430.26 | 399.21 | 19.66 |
| New Mexico | 502.60 | 601.30 | 98.71 | 19.64 |
| Minnesota | 1708.47 | 2037.70 | 329.23 | 19.27 |
| South Dakota | 395.23 | 470.79 | 75.56 | 19.12 |
| New York | 3608.97 | 4294.03 | 685.06 | 18.98 |
| Mississippi | 1164.98 | 1385.92 | 220.95 | 18.97 |
| Connecticut | 975.34 | 1159.98 | 184.64 | 18.93 |
| Ohio | 3688.39 | 4366.96 | 678.58 | 18.4 |
| Utah | 806.79 | 949.95 | 143.16 | 17.74 |
| Wisconsin | 1674.39 | 1970.87 | 296.48 | 17.71 |
| Alaska | 180.40 | 211.54 | 31.15 | 17.27 |
| New Jersey | 1952.53 | 2287.46 | 334.93 | 17.15 |
| Oregon | 1720.82 | 2009.77 | 288.95 | 16.79 |
| Illinois | 3121.92 | 3604.65 | 482.73 | 15.46 |
| Kansas | 895.65 | 1031.08 | 135.44 | 15.12 |
| Indiana | 2378.45 | 2733.24 | 354.79 | 14.92 |
| Vermont | 183.05 | 210.13 | 27.08 | 14.79 |
| Massachusetts | 1404.55 | 1606.25 | 201.69 | 14.36 |
| Arizona | 2116.37 | 2415.13 | 298.75 | 14.12 |
| Michigan | 2519.65 | 2835.01 | 315.37 | 12.52 |
| Nevada | 804.60 | 902.15 | 97.55 | 12.12 |
| North Dakota | 449.47 | 499.79 | 50.33 | 11.2 |
| Texas | 10148.36 | 11071.62 | 923.27 | 9.1 |
| Rhode Island | 221.78 | 238.16 | 16.38 | 7.39 |
| Maine | 392.67 | 420.55 | 27.89 | 7.1 |
| California | 6216.85 | 6546.37 | 329.52 | 5.3 |
| Hawaii | 232.65 | 240.42 | 7.77 | 3.34 |
| Florida | 9108.23 | 9107.46 | -0.78 | -0.01 |
| Louisiana | 1938.47 | 1197.20 | -741.21 | -38.24 |
| US Total | 101906.59 | 118916.96 | 17010.37 | 16.69 |
To save even more, consider using timers for your lights or switching to solar-powered options. Solar-powered lights, which are increasingly popular among eco-conscious households, eliminate electricity costs entirely and reduce carbon footprints.5
What States Reduce Power Costs During December?
Out of the 50 states, only 7 had an increase in power costs from November 2023 to December 2023. They are Alaska, Idaho, Massachusetts, Maryland, Michigan, New Jersey, and Rhode Island with Rhode Island recording the highest increase at 3.63%.10
All other states experienced a price decrease from the same period. Oklahoma experienced the largest decrease in electricity prices with a drop of 9.18%, followed closely by Nevada with a decrease of 9.12%.10
Trends in Sustainable Holiday Decorating
Sustainability is becoming a key theme in holiday decorating.
More families are opting for reusable decorations and eco-friendly lighting solutions, such as solar-powered string lights.5 These lights are not only environmentally friendly but also add a modern twist to traditional decor.
Furthermore, artificial trees made from recycled materials are gaining traction as a sustainable alternative to real trees.
The U.S. Department of Energy highlights the potential of widespread LED adoption to save the country billions of dollars in electricity costs by 2027, reducing strain on the power grid and contributing to a greener future.1
Communities like Gatlinburg are leading the charge by incorporating green initiatives such as hybrid trolleys, LEED-certified buildings, and advanced recycling programs into their citywide celebrations.8
And for environmentally conscious individuals, these trends offer a way to celebrate the season responsibly.
Fun Holiday Lighting Facts
Holiday lighting isn’t just about function—it’s also about fun.
Did you know that LEDs are so durable that a single string could last up to 40 years if used seasonally?1 Or that the earliest Christmas lights were hand-wired by Thomas Edison’s assistants in the late 1800s?
Today, lights have become a form of creative expression, with synchronized light shows and music becoming a popular trend.
Around the world, lighting traditions vary widely. In Finland, lighting candles on Christmas trees is still practiced in some households, honoring centuries-old customs.4
These unique traditions add depth and diversity to the way we celebrate.
Tips For Creating Your Own Holiday Magic
Decorating your Christmas tree and home can be a joyous and creative endeavor. Here are some tips to elevate your holiday decor while being mindful of costs and sustainability:
- Switch to LEDs: Reduce energy costs and enjoy brighter, longer-lasting lights.
- Use timers: Set your lights to turn off during the day or late at night to save energy.
- Get creative: Experiment with themes, like a winter wonderland or a retro vibe with colorful lights.
- Incorporate solar-powered options: Light up your yard without adding to your electricity bill.
Take a cue from Gatlinburg’s efforts to combine aesthetics with sustainability.
Whether it’s using LED lights or incorporating recycled materials, even small changes can have a big impact.
Christmas tree lighting trends are an exciting mix of tradition, innovation, and sustainability. From the energy efficiency of LED lights to the charm of regional displays and the push for eco-friendly practices, there’s something for everyone this holiday season.
Whether you’re inspired by the glowing streets of Gatlinburg or the sustainable tips from energy experts, your decorations can shine bright without costing the earth.
References
1McCarthy, N. (2015, December 9). LEDs: Christmas Lighting Revolutionized. statista. Retrieved December 3, 2024, from <https://www.statista.com/chart/4120/leds_christmas-lighting-revolutionized/>
2Market Research Intellect. (2024, December). Pre Lit Artificial Christmas Tree Market Size and Projections. Market Research Intellect. Retrieved December 3, 2024, from <https://www.marketresearchintellect.com/product/global-pre-lit-artificial-christmas-tree-market-size-and-forecast/>
3Liang, S. (2024, November 29). LED Lighting vs Traditional: What’s The Difference? Vorlane. Retrieved December 3, 2024, from <https://vorlane.com/led-lighting-vs-traditional-whats-the-difference/>
4RATHBORNES. (2023, December 18). Candles Around the World: Exploring Different Holiday Traditions. RATHBORNES. Retrieved December 3, 2024, from <https://www.rathbornes1488.com/en-in/blogs/news/candles-around-the-world-exploring-different-holiday-traditions>
5New Day Solar. (2024, July 18). Transform Your Space Using Outdoor Solar Lights and More. New Day Solar. Retrieved December 3, 2024, from <https://www.newdaysolar.com/transform-your-space-using-outdoor-solar-lights-and-more/>
6Méndez, M. (2024, October 24). The 28 Best Christmas Light Displays + Tours for 2024. U.S. News Travel. Retrieved December 3, 2024, from <https://travel.usnews.com/features/the-best-christmas-light-displays-in-the-us>
7The Editors of House Beautiful. (2023, November 8). 32 Towns With the Best Christmas Light Displays in the Country. House Beautiful. Retrieved December 3, 2024, from <https://www.housebeautiful.com/entertaining/holidays-celebrations/g25559575/best-christmas-light-displays-in-us/>
8Gatlinburg CVB. (2024). Sustainability. Gatlinburg. Retrieved December 3, 2024, from <https://www.gatlinburg.com/plan/about-gatlinburg/gatlinburg-goes-green/sustainability/>
9U.S. Department of Energy. (2015, December 16). How Do Holiday Lights Work? U.S. Department of Energy. Retrieved December 3, 2024, from <https://www.energy.gov/articles/how-do-holiday-lights-work>
10U.S. Energy Information Administration. (2024). Electricity sales to ultimate customer by state and sector. EIA. Retrieved December 3, 2024, from <https://www.eia.gov/opendata/browser/electricity/retail-sales?frequency=monthly&data=price;&facets=stateid;sectorid;&stateid=AK;AL;AR;AZ;CA;CO;CT;DE;FL;GA;HI;IA;ID;IL;IN;KS;KY;LA;MA;MD;ME;MI;MN;MO;MS;MT;NC;ND;NE;NH;NJ;NM;NV;NY;OH;OK;OR;PA;RI;SC;SD;TN;TX;US>
11Graham, M. (2024, July 30). How Many Feet of Christmas Lights Do You Need For Your House? Angi. Retrieved December 3, 2024, from <https://www.angi.com/articles/how-to-calculate-christmas-lights-needed.htm>
12U.S. Energy Information Administration. (2024). Revenue from Sales to Ultimate Customers. EIA. Retrieved December 3, 2024, from <https://www.eia.gov/opendata/browser/electricity/retail-sales?frequency=monthly&data=revenue;&facets=stateid;sectorid;&stateid=AK;AL;AR;AZ;CA;CO;CT;DE;FL;GA;HI;IA;ID;IL;IN;KS;KY;LA;MA;MD;ME;MI;MN;MO;MS;MT;NC;ND;NE;NH;NJ;NM;NV;NY;OH;OK;OR;PA;RI;SC;SD;TN;TX;UT;VA;VT;WA;WI;WV;WY;§orid=RES;&start=2023-11&end=2023-12&sortColumn=stateid;period;&sortDirection=asc;asc;>
13U.S. Energy Information Administration. (2024). Megawatt-hours Sold to Ultimate Customers. EIA. Retrieved December 3, 2024, from <https://www.eia.gov/opendata/browser/electricity/retail-sales?frequency%3Dmonthly%26data%3Dsales;%26facets%3Dstateid;sectorid;%26stateid%3DAK;AL;AR;AZ;CA;CO;CT;DE;FL;GA;HI;IA;ID;IL;IN;KS;KY;LA;MA;MD;ME;MI;MN;MO;MS;MT;NC;ND;NE;NH;NJ;NM;NV;NY;OH;OK;OR;PA;RI;SC;SD;TN;TX;US;UT;VA;VT;WA;WI;WV;WY;%26sectorid%3DRES;%26start%3D2023-11%26end%3D2023-12%26sortColumn%3Dstateid;period;%26sortDirection%3Dasc;asc&sa=D&source=docs&ust=1733348819969739&usg=AOvVaw30KNuCaXigss_fpHUcWBGy>