Social media platforms have become an essential part of everyday life, with an astounding 5.04 billion users worldwide.1
While these platforms have revolutionized communication and content sharing, the rapid increase in digital activity comes with an environmental cost—rising energy consumption and carbon emissions driven by the infrastructure supporting social media.
Global Social Media Trends and Regional Differences
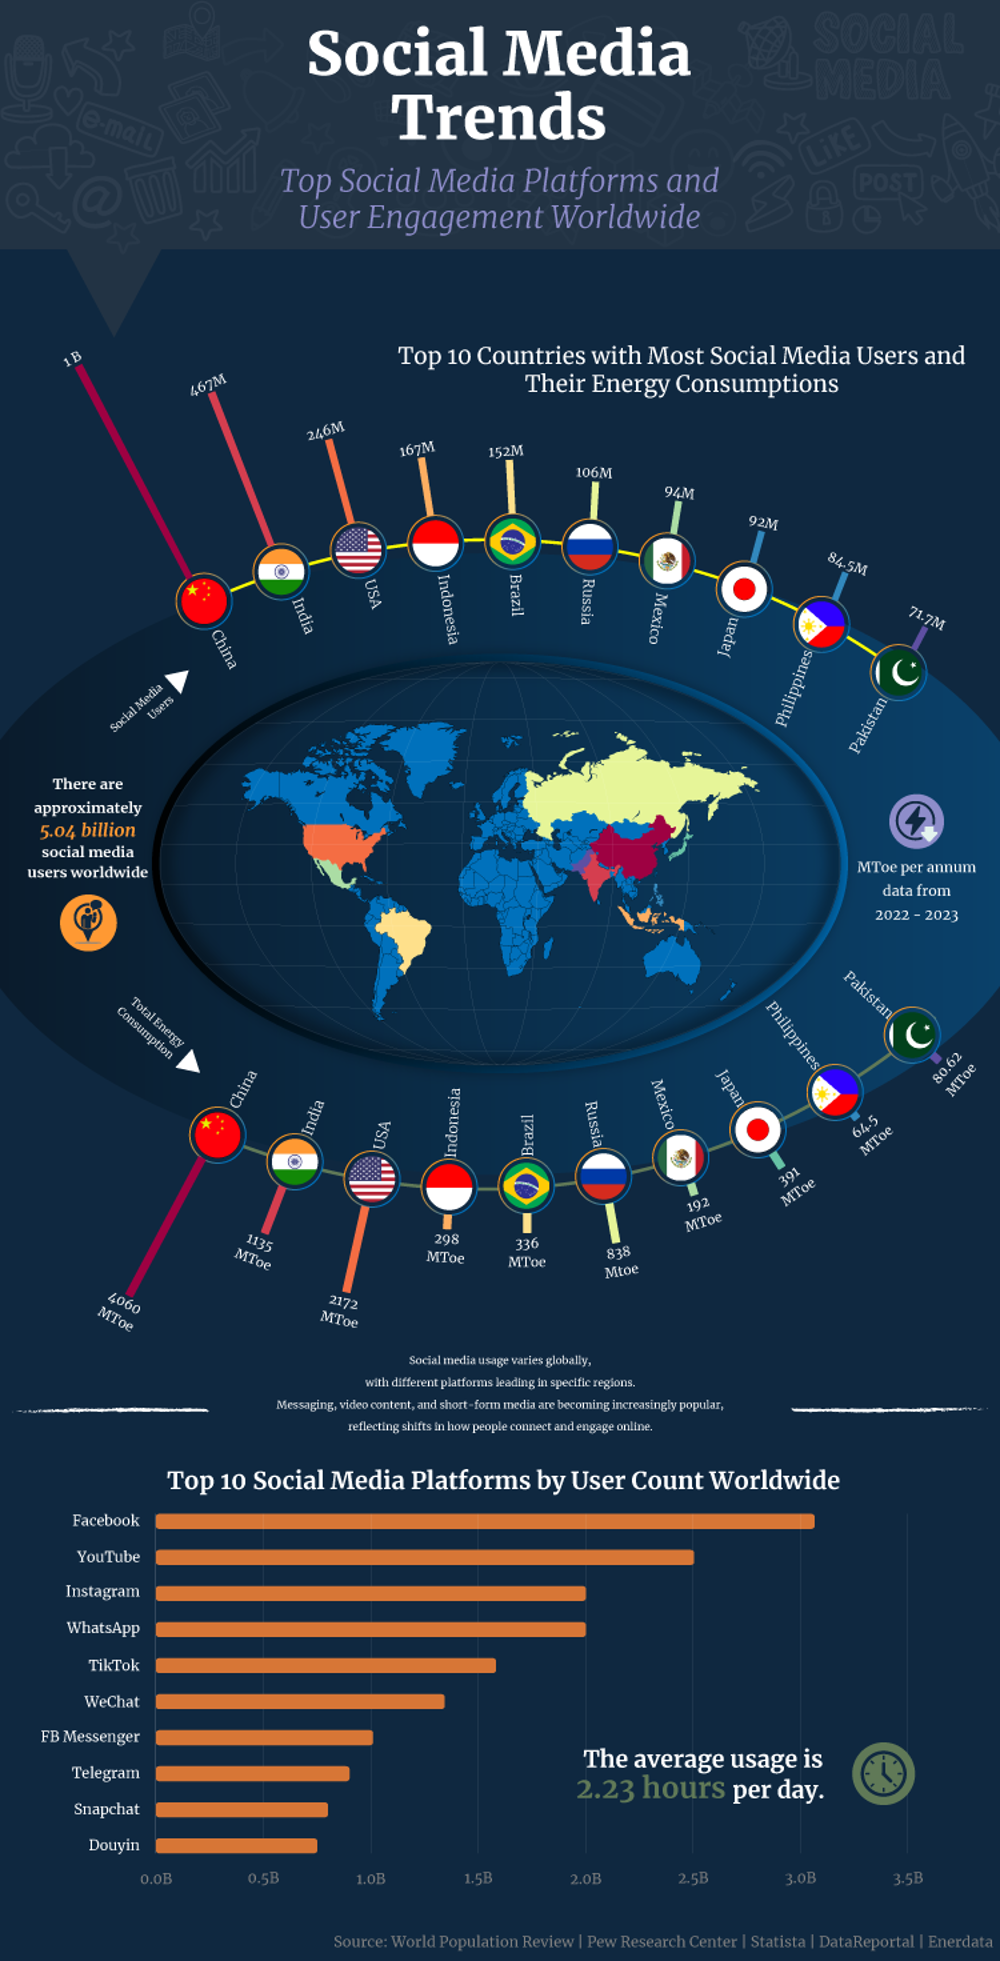
The top 10 countries with the most social media users reflect a mix of economic giants and rapidly digitalizing nations.
China tops the list with over 1 billion users, followed by India with 467 million, and the United States with 246 million.2 These figures align with large populations and expanding digital infrastructure.
Notably, countries such as Brazil and Indonesia also feature among the top social media users, showcasing the increasing reach of platforms like Facebook, YouTube, and Instagram.3
According to Statista, the most popular platforms—Facebook, YouTube, and WhatsApp—dominate user engagement worldwide.2
However, newer platforms like TikTok have surged, reflecting a shift toward short-form video content.
On average, individuals spend 2.23 hours daily on social media.3
These patterns demonstrate how deeply these platforms have become embedded in modern life, but they also highlight the environmental implications of increased online activity.
Correlation Between Energy Use, Emissions, and Social Media Growth
The rise in social media use has a direct correlation with increased energy consumption and carbon emissions. Every post, message, and video interaction requires energy to power data centers, servers, and networks.
Platforms such as Facebook and YouTube, which handle billions of interactions daily, rely on energy-intensive infrastructure.
Website Carbon reports that the average website generates 1.76 grams of CO₂ per page view, adding up to significant emissions when scaled across billions of users.4
Countries with large social media populations, such as China and India, also exhibit massive energy consumption—4060 MToe and 2172 MToe, respectively.5,6
As more users engage with these platforms, the operational load on data centers increases, raising carbon emissions, especially in regions where fossil fuels dominate the energy mix.
For instance, Russia and Brazil show high energy consumption, with 836 MToe and 336 MToe, respectively.6
Even smaller markets like Pakistan and the Philippines are seeing rising digital footprints as infrastructure expands.7
The Sustainability Challenge: Balancing Connectivity With Environmental Responsibility
The exponential growth of digital activity presents both a social and environmental challenge. Without investments in renewable energy and energy-efficient infrastructure, the carbon footprint of social media will continue to rise.
Governments and companies must collaborate to adopt carbon offsets and promote green technology to mitigate the impact. Transitioning to sustainable energy sources will be essential to ensure that digital growth does not come at the cost of the planet.
The correlation between social media growth and emissions underscores the need for a sustainable digital strategy.
As the world becomes increasingly connected, striking a balance between the benefits of connectivity and the environmental costs will be critical for future generations.